A New Product for Comprehensive and Accurate Profiling of Immunoglobulin (IG) and T-cell Receptor (TR) gene Rearrangements
Background
The complementarity-determining regions (CDRs) in T cell receptor (expressed in T lymphocytes) and immunoglobulin (expressed in B lymphocytes) enable recognition and binding to major histocompatibility complex (MHC) antigen peptides. The diversity of CDRs is a cornerstone for adaptive immune response, which is achieved through rearrangement of V (variable), D (diversity), and J (joining) genes of the immunoglobulin (IG) and T cell receptor (TR) gene segments. Additional base alterations at the junction regions (generated during the rearrangements) are also contributed to the diversity of CDRs. The CDR is composed of the CDR1, CDR2, and CDR3, with CDR3 having the highest diversity. The CDR1 and CDR2 are encoded solely by the V gene, and the CDR3 is encoded by the V, D and J genes. Immune repertoire analysis plays an important role in the immune response study and the immunotherapy (e.g. tumor prognosis evaluation, leukemia minimal residual disease detection, autoimmune disease diagnosis, and biomarker study, etc).
Introduction
The IGTR Panel v1.0 covers the entire IG and TR coding gene segments of the human genome. Due to the high fault-tolerance feature of the hybridization enrichment with probe, it is also suitable for the enrichment of segments before or after rearranged by V(D)J recombination at the DNA level, and the enrichment of mature transcript at the RNA level.
The IGTR Panel v1.0 was designed based on the latest version of reference genomic sequences, covering all the V, D, J, and C genes (Table 1). The panel also captures the junction regions of the V (D) J rearranged sequence using probes that targeting the adjacent regions. Moreover, these probes are also capable of capturing spliced IG and TR gene sequences of RNA samples (Figure 1).
Table 1. Gene list of the IGTR Panel v1.0
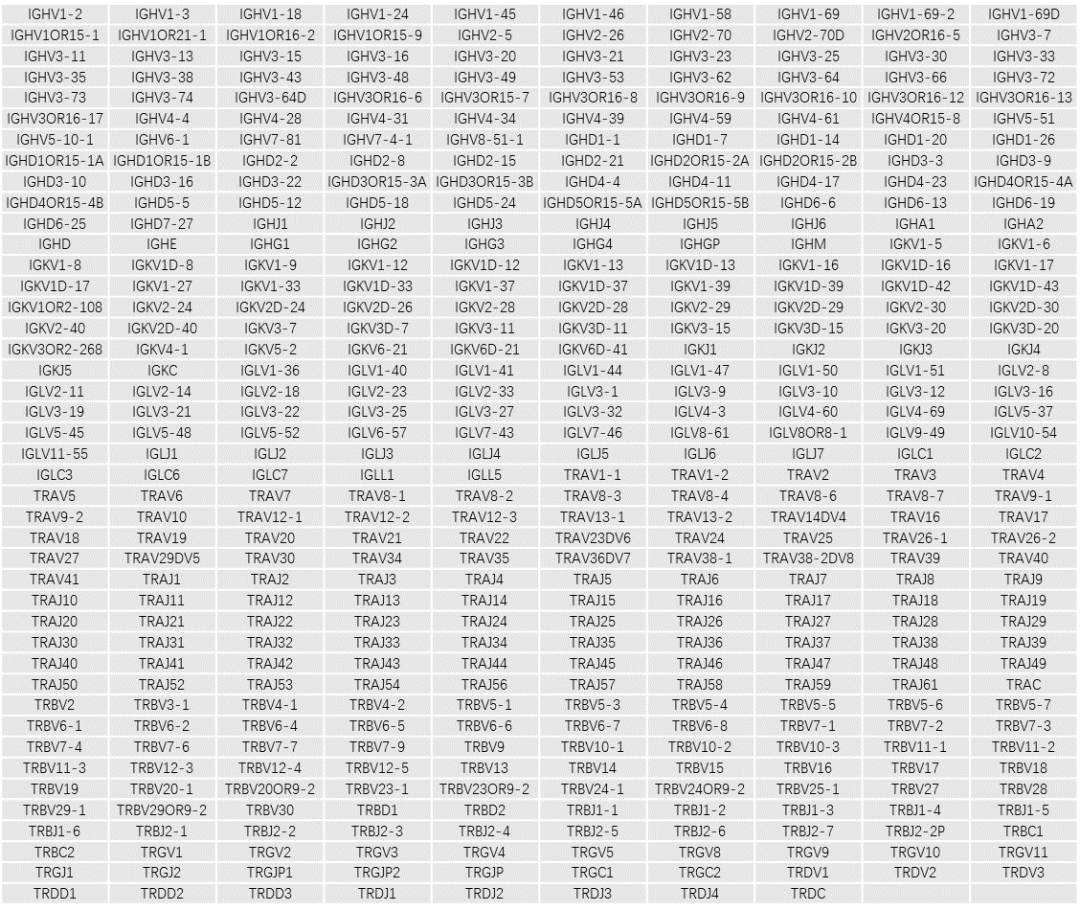
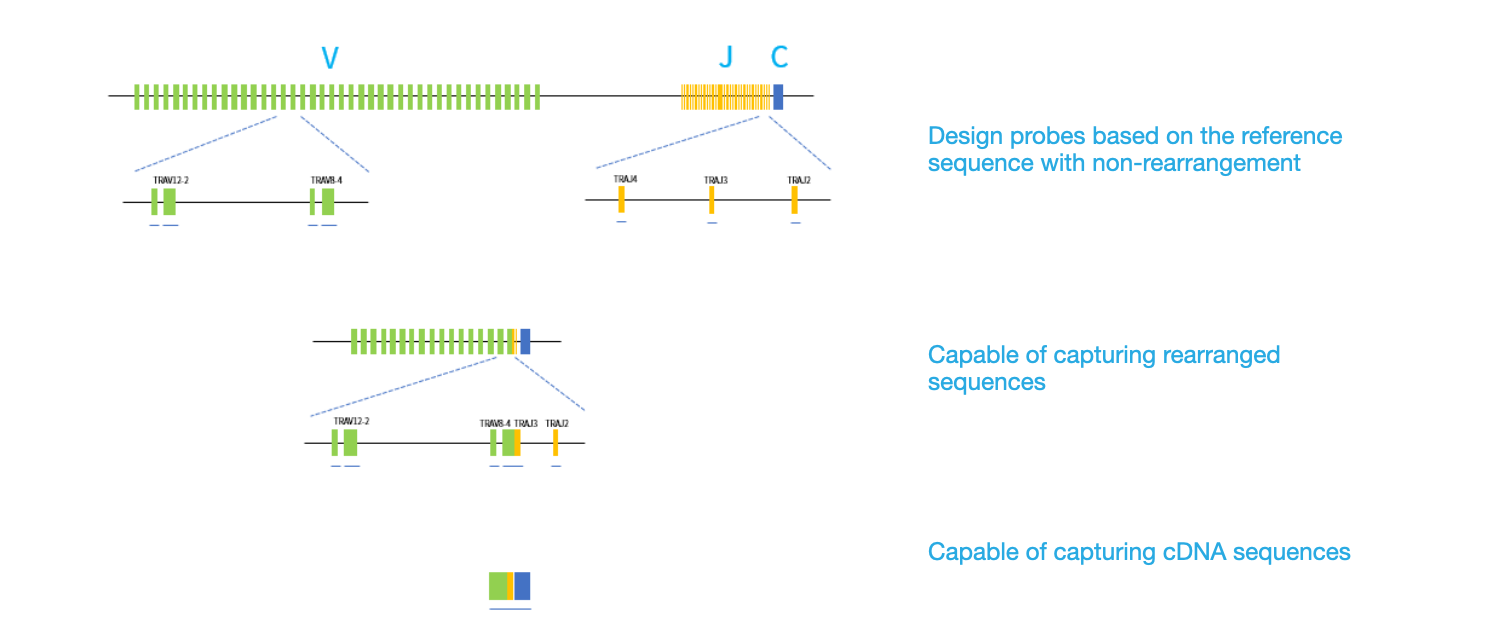
Figure 1. Schematic diagram showing the distribution of the probes that targeting the non-rearranged/rearranged genomic DNA and cDNA sequences of the α T-cell receptor (TRA) gene loci.
The rearranged cDNA sequencesof the IG and TR genes differed most from the non-rearranged germline sequences. However, as shown in Figure 2, the CDR3 region was also effectively captured due to the presence of sufficient probe binding regions in the upstream and downstream of that region.
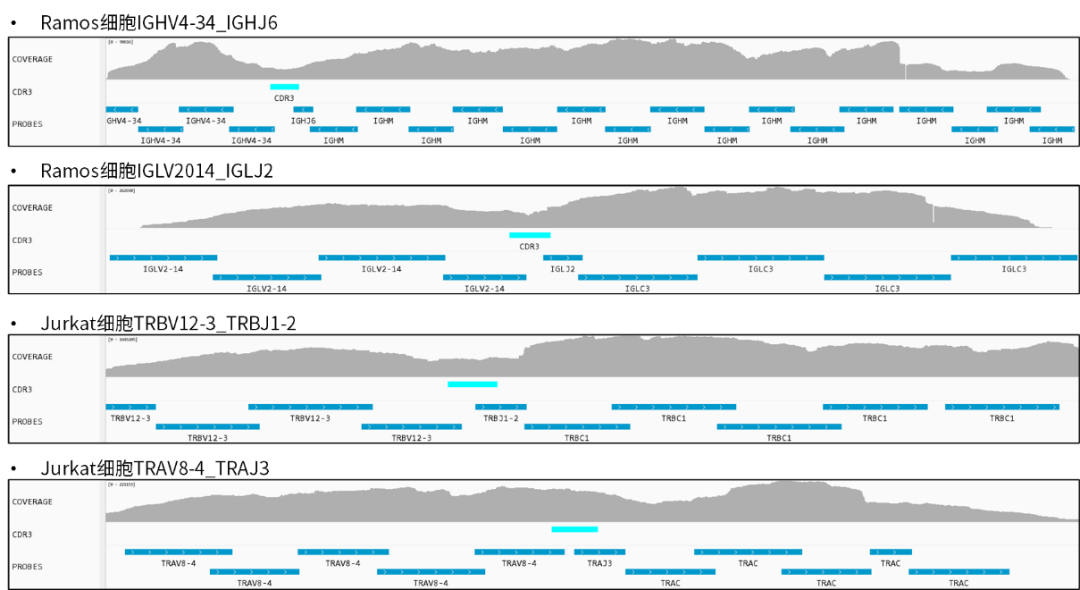
Figure 2. Target sequencing results of cDNA samples derived from RAMOS cell lines (IGHV4-34_IGHJ6, IGLV2-14_IGLJ2) and JURKAT cell lines (TRAV8-4_TRAJ3, TRBV12-3_TRBJ1-2) using the IGTR Panel v1.0. The probes and the CDR3 regions are highlighted in dark blue and light blue, respectively.
The IGTR Panel v1.0 enables you to determine the rearrangement pattern of the IG and TR genes when using a genomic DNA specimen. The genomic DNA of JURKAT cell was used to test the IGTR Panel v1.0. Sequencing reads that revealed the rearrangement pattern between the TRAV8-4 and TRAJ3 loci are shown in Figure 3.
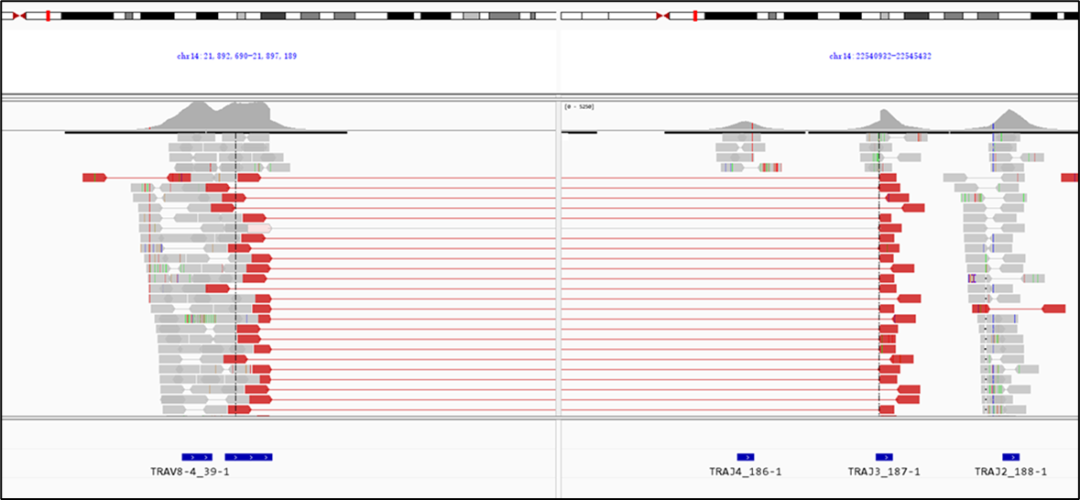
Figure 3. An immune repertoire testing result of a genomic DNA sample extracted from the JURKAT cell, using the IGTR Panel v1.0. Sequencing reads that cover the TRAV8-4 and TRAJ3 loci are aligned to the hg38 reference sequence.
Performance
The 5'RACE-based amplicon sequencing method covers only the CDR regions of the immune repertoire, whereas the IGTR Panel v1.0 is designed to cover the entire IG and TR genes, extending its application. However, this approach results in lower coverage depth at the highly interesting CDR3 region. Despite the expanded target regions, the testing sensitivity at the RNA level does not decrease. Based on the testing results of gradient diluted cDNA samples derived from cell lines (Figure 4), we found that the detection sensitivity of the IGTR Panel v1.0 was comparable to that of other amplicon-based methods. Although more sequencing reads (most of which are PCR duplicates) can be obtained through amplicon-based methods under equivalent conditions, they do not significantly improve sensitivity.
The sensitivity of detecting mutations in genomic DNA specimens is significantly lower compared to RNA specimens. This is because unexcised regions and untranscribed IG and TR genes are also sequenced, leading to increased noise in the data. Therefore, genomic DNA sequencing is recommended for target sequencing of monoclonal samples, where the data processing algorithm can perform well. For polyclonal samples, equivalent sequencing depths are required to ensure accurate analysis.
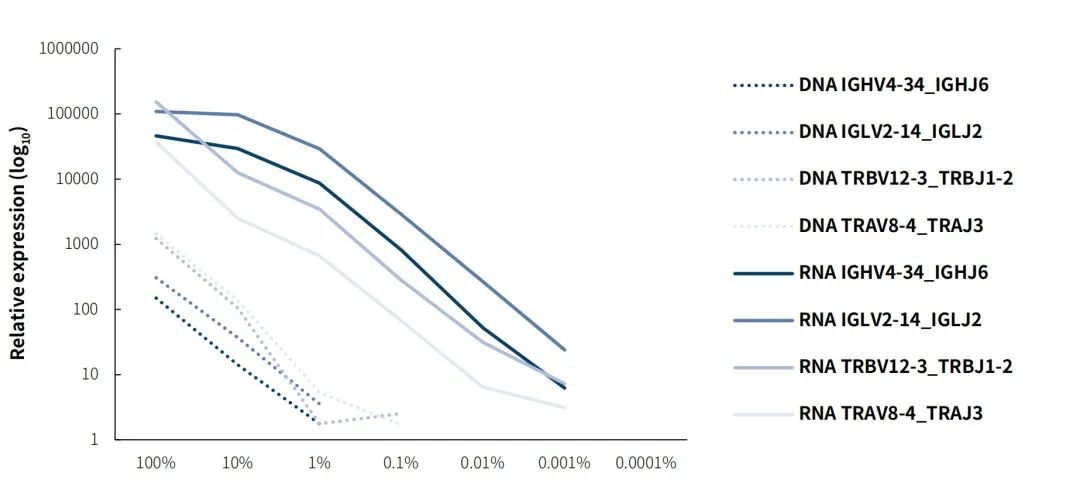
Figure 4. Capture sensitivity performance of IGTR Panel v1.0 on DNA and RNA specimens. Libraries were prepared using the NadPrep Total RNA-To-DNA Module coupled with the NadPrep DNA Universal Library Preparation Kit (for Illumina®). Target enrichment was performed using the IGTR Panel v1.0. The sequencing mode: Illumina Novaseq 6000, PE150
Note:RAMOS+JURKAT DNA was gradient diluted with human male genomic DNA (Promega-male, G1471); RAMOS+JURKAT RNA was gradient diluted with total RNA of peripheral blood cells (TAKARA, 636592).
The IGTR Panel v1.0 captures both the IG and TR genes simultaneously. Although the ratio between the IG and TR reads may vary greatly in different samples, this has little influence on the on-target rate (see Figure 5).
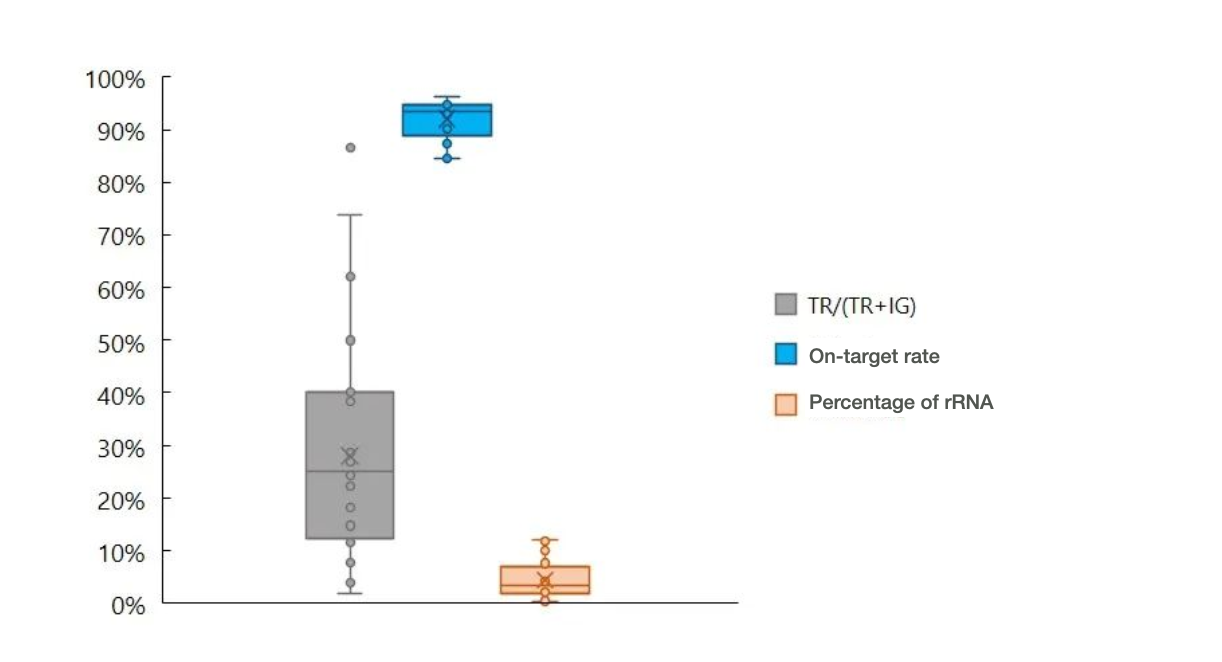
Figure 5. An immune repertoire testing result of a donated blood sample showed the percentage of TR reads, on-target rate, and percentage of ribosomal RNA reads, using the IGTR Panel v1.0 (sequencing data was processed using the salmon algorithm).
In the future, we will share more immune repertoire sequencing cases and data processing methods that related to the IGTR Panel v1.0. Please stay tuned to learn more!
Solutions
- Methyl Library Preparation Total Solution
- Sequencing single library on different platform--Universal Stubby Adapter (UDI)
- HRD score Analysis
- Unique Dual Index for MGI platforms
- RNA-Cap Sequencing of Human Respiratory Viruses Including SARS-CoV-2
- Total Solution for RNA-Cap Sequencing
- Total Solution for MGI Platforms
- Whole Exome Sequencing
- Low-frequency Mutation Analysis
Events
-
Exhibition Preview | Nanodigmbio invites you to join us at Boston 2025 Annual Meeting of the American Society of Human Genetics (ASHG)

-
Exhibition Preview | Nanodigmbio Invites You to Join Us at WHX & WHX Labs Kuala Lumpur 2025, Malaysia International Trade and Exhibition Centre in Kuala Lumpur

-
Exhibition Preview | Nanodigmbio Invites You to Join Us at Hospitalar 2025, Brazil International Medical Device Exhibition in São Paulo

-
Exhibition Preview | Nanodigmbio invites you to join us at Denver 2024 Annual Meeting of the American Society of Human Genetics (ASHG)

-
Exhibition Preview | Nanodigmbio invites you to join us at Sapporo 2024 Annual Meeting of the Japan Society of Human Genetics (JSHG)

-
Exhibition Preview | Nanodigmbio invites you to join us at Association for Diagnostics & Laboratory Medicine (ADLM)


